Node Basics
Overview
A node is the basic building block of a Screenberry project. Each node visually represents a specific function, offering a modular and flexible approach to creating a project's workflow. While the functions of Screenberry nodes differ, their operation follows uniform principles, offering a consistent and intuitive experience for users.
Creating a project in Screenberry involves adding nodes, connecting them to form a node graph, and modifying their parameters. The node graph serves as the blueprint for your project, providing a clear visualization of its structure, functional interactions, and data flows. The process of creating a node graph is managed within the Node Graph widget, accessible in the Screenberry Panel under Window > Node Graph.
Node Structure

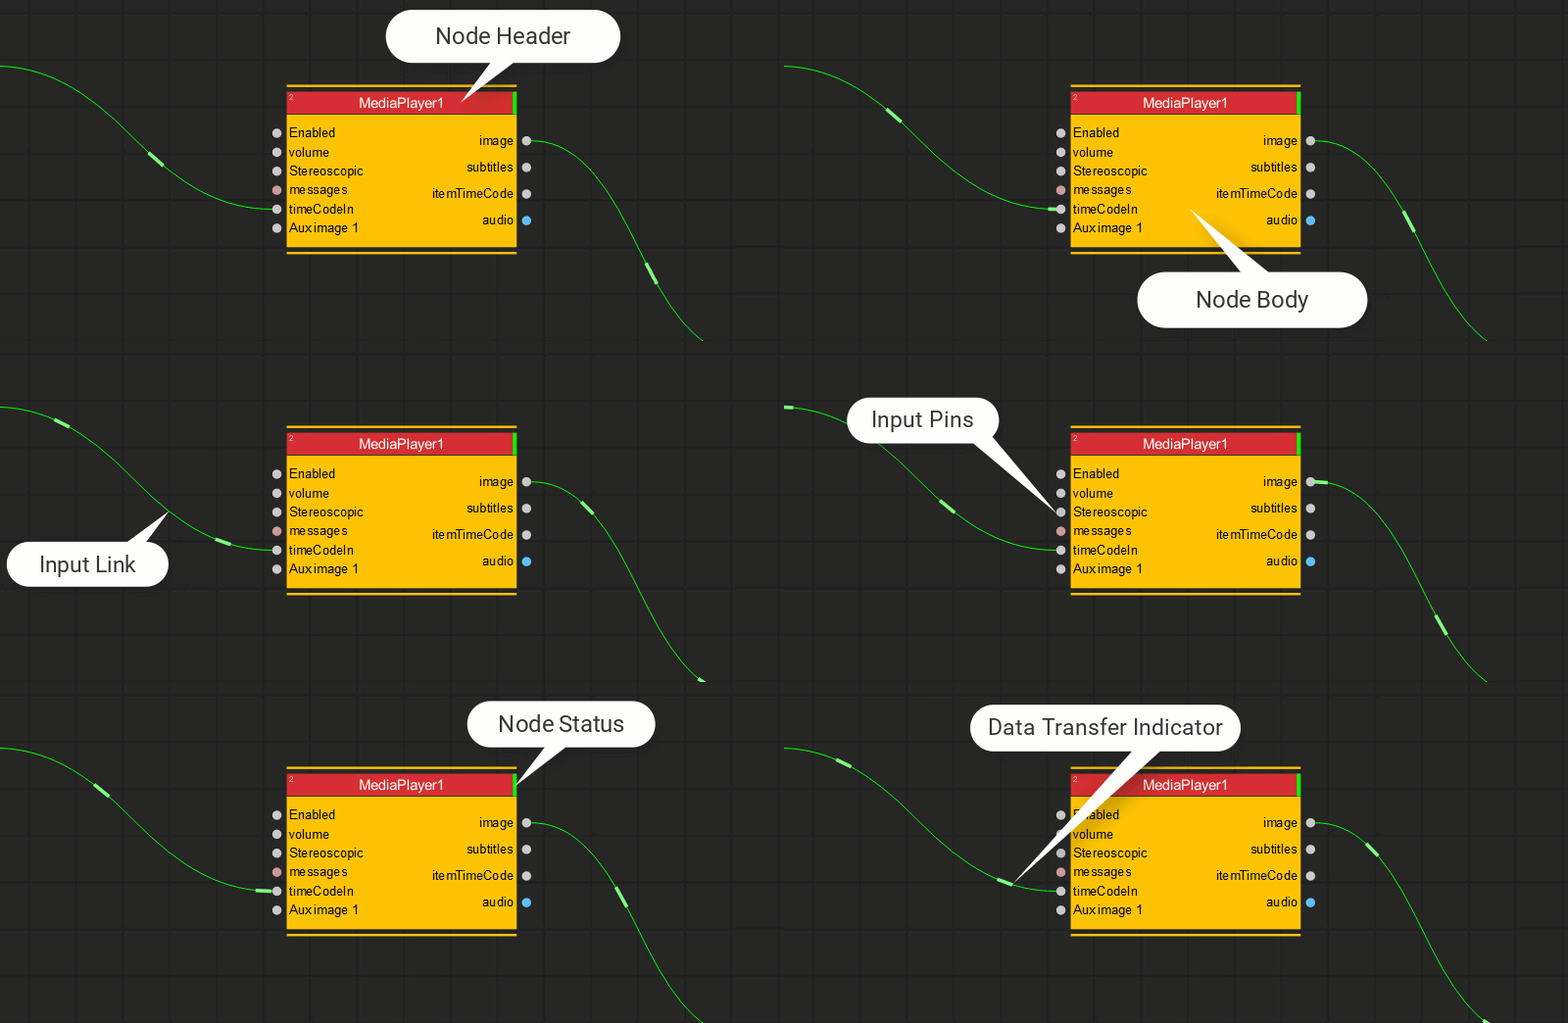
Each node in Screenberry consists of two visually distinct parts: the header and the body.
The Node Header provides essential information about the node:
- Node Name.
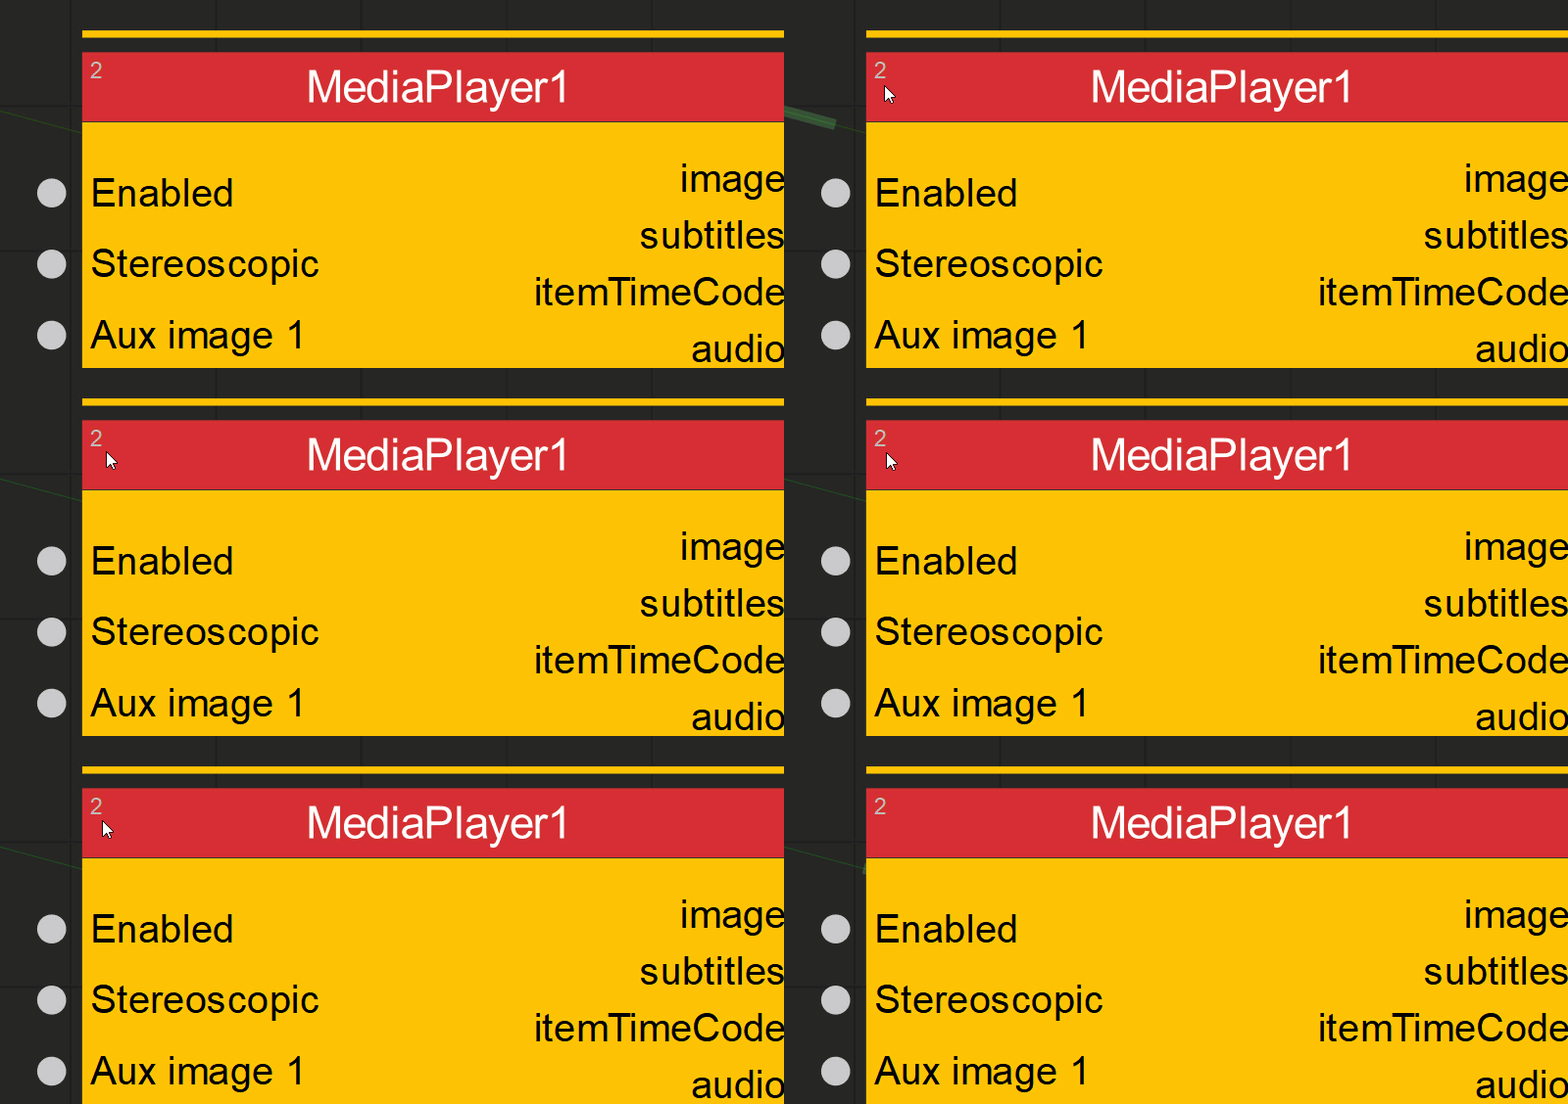
- Execution Order Number: Located in the top-left corner, this number shows the sequence in which the node will be processed relative to other nodes.
- Node Status Indicator: A colored bar on the right side of the header that indicates the node's current operational state. Refer to the Node Status section for more details.
The Node Body displays the input and output parameters:
- Input Parameters: Displayed on the left, these parameters indicate the data or settings the node can receive.
- Output Parameters: Listed on the right, these parameters represent the results or data produced by the node.
When a node is selected, its parameters can be viewed and adjusted in the node's Settings panel. For additional information, refer to the Node Settings section.
Node Graph Structure and Data Flow
The node graph is built by adding and linking nodes. Data flows from left to right through links between the right-side output pins and left-side input pins of the nodes. This structured flow creates a clear, unidirectional data pathway, visually representing the processes that result in the rendered video, images, and audio.
 Example of a Screenberry node graph
The operational order of nodes is dynamically adjusted to reflect any changes you make to the node graph’s layout. To determine the processing sequence of a particular node, refer to the execution order number displayed on its header.

The node graph provides a visual representation of data flow within your project. Various data types can be transmitted, ranging from numerical values and text strings to images, audio, specific messages, timecodes, and actions. Connections between nodes are typically displayed as gray lines, though selecting a node will highlight its connections in green.
When data is transferred between nodes, the connecting link becomes animated, indicating the direction of the transfer.

Node Status
To modify a node's status, right-click on the node and select or deselect the Enabled checkbox in the dropdown menu. Alternatively, you can select the node and adjust the Enabled option within the node’s Settings. When the node is disabled, its background shifts to a lighter shade, and it is marked with crossed diagonal lines.

The status of a node is displayed by a colored bar on the right side of its header, indicating one of three states:
 Enabled and Active (Green)
 Disabled (Gray).
 Enabled but not Active (Red).


